In this three-part blog series, we’re breaking down one of our favourite service design tools: Customer Journey Maps! We cover:
-
Customer Journey Mapping 101: What are customer journey maps, and why do you need them?
-
Customer Journey Mapping 201: How to Research and Build a Customer Journey Map (this post)
-
Customer Journey Mapping 301: Designing for the future, evolving your map, and making it actionable
In this post, we’ll really get into the “nuts and bolts” of customer journey research and map building.
We will explore:
-
The best mixed method research to collect data for your journey map
-
Goal-setting and research questions to ask to get at the data points you need
-
Anatomy of a good journey map
-
How to visually bring it all together
Begin with the end in mind, before you start.
It’s very important to identify and set clear goals to truly reap the benefits of customer journey mapping. The clearer and more precise your research goals are, the clearer your findings will be.
A few examples of strong research goals include:
-
To better understand the factors that contribute to first-year renewal of an online membership/subscription
-
To better understand the decision-making process for first-time home buyers seeking a mortgage provider
-
To uncover why such a high volume of customers are making calls to a company’s support centre
Remember to also strategically select the type of journey map you’d like to build (we explore this at length in Part One of this series), and the user groups/personas you should be targeting with your research.
Research and Data Collection
Conducting mixed methods research is the best way to gather information from and about your customers to build an effective and insightful journey map. As you conduct user research, try to ensure that, as much as possible, you are capturing their journey––the step-by-step process that each individual user takes during their day (or month/year) as they interact with a service or product.
As a rule of thumb, you should also seek to engage in “data triangulation”. This means using three (or more) data sources (e.g. a survey, user interviews, and a workshop) to ensure your findings are robust.
Here are the five top research methods we recommend for building journey maps:
-
Surveys are great when you have easy access to a large pool of target participants (e.g. through a newsletter or mailing list). Surveys also allow you to gather quantitative as well as qualitative feedback all at once.
-
User Interviews (in-depth and one-on-one) will allow you to flesh out journey maps in detail. In another blog post, we explore how to conduct effective and well-organized one-on-one interviews with users/customers.
-
Observations (contextual research) involve observing participants in their “natural habitat”, like a fly on the wall. We highlight our best practices for conducting observations here.
-
Diary studies involve giving participants a “diary” or workbook to complete on a daily or weekly basis. Read more about how to conduct an effective diary study here.
-
Participatory workshops involve hosting a workshop with users where you have them actually map out the journey themselves. We explore best practices for holding a design workshop in a previous post, as well.
Asking the Right Questions
Once you’ve selected the research methods you’ll use to collect data for your journey map – what questions should you ask? This will depend on your goals.
In general, the key information you’ll need to collect from the research activities to build your journey map includes:
-
Demographic and segment information
-
User goals, motivations, and needs
-
Journey Information: Questions related to specific touchpoints, activities, and tasks, e.g. “Please describe a typical day in your life”, “Tell me about your experience with X,Y, Z”, or “Can you describe the steps you took to ….”
-
User Pain Points: What are the most frustrating parts of their journey? How do users feel, and what are they thinking? Try to capture verbatim quotes here from users, as well as images/video if you are shadowing or conducting a diary study.
A few more things to consider as you conduct research:
-
Consider the time interval you would like to map. Are you seeking to map a user’s interaction with a brand over a year? A few months? One day?
-
Consider the level of detail you need to show in the map. For example, if you are trying to understand a “day-in-the-life” of a user (e.g. a person’s experience arriving at and watching a sporting event), you could shadow them and capture their day in a lot of detail. But if you are mapping a journey over three months, the level of detail will naturally be less (otherwise the map will be too long and overwhelming for readers). Remember that participants will also have more difficulty recalling high levels of detail from activities they engaged in one week vs. one month ago.
-
Journeys are easier to map in chronological order. As you ask questions and observe users, consider the order in which they perform activities/tasks.

Anatomy of a Journey Map
Let’s break down the components of a strong customer journey. While each journey map and project is different, there are certain pillars we typically include:
-
Personas –– Whose journey are you mapping out?
-
Phases –– Are there any distinct phases in the customer journey, or a collection of tasks that mark a transition? For example, for a first-time home buyer, phases may include “Researching Mortgages”, “House Search”, “Financing” “Offer and Purchase”, and “After Purchase”.
-
Motivations –– What are the users’ motivations as they go through each phase? For a house purchaser, a motivation may be “Find the best financing deal”.
-
Tasks and activities –– What are all of the tasks users need to complete in order to accomplish their goal?
-
Thoughts and Feelings –– How do users feel as they go about their tasks and proceed through each phase? Stressed, anxious, excited? You can include verbatim quotes from your research here.
-
Touchpoints –– What are the users’ points of interaction with the organization? (E.g. website, in-person meeting, phone call with an agent, and so on).
-
Tools and technology –– What apps are customers using for a particular task?
-
Pain points –– What challenges are users experiencing as they accomplish certain tasks?
-
Key Moments –– What are pivotal moments in the user’s journey that make or break their experience? Similarly, what are the happy and memorable moments?
-
Opportunities –– Ideas, solutions, and improvements to the pain points.
Note: Adding “Opportunities” to your journey map is important. Each pain point in theory could be turned into an opportunity. Yet, to be truly useful, we recommend running a co-design workshop or brainstorming session with stakeholders and/or users to come up with valuable solutions to the pain points and real opportunities for innovation.
View this post on Instagram
Click through to explore a detailed customer journey map…
Building your Journey Map
Now that you’ve completed the research, there are FOUR key steps to building your customer journey map.
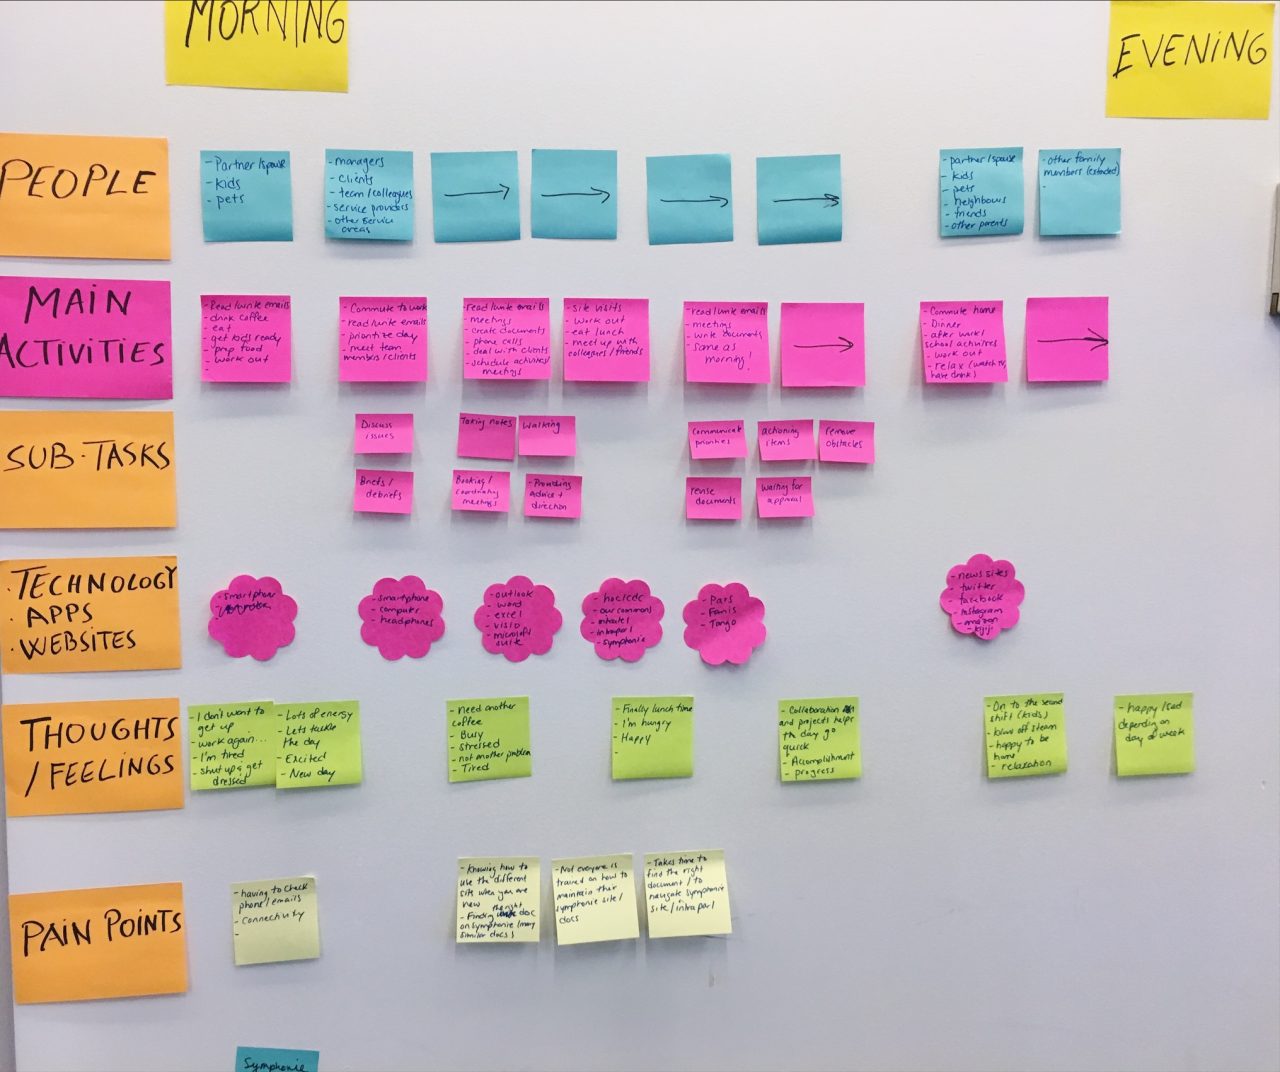
1. Sketch out individual journey maps for your users, based on the research. Ideally, you’ll do this as a debrief after each interview and/or observation session . No two journeys are exactly alike, and as you perform more research and talk to more customers, their journeys will certainly begin to blur. By sketching and mapping out individual journeys after each interview or observation session, you can more easily compare and contrast individual journeys and locate patterns (see Step #2 below) to create your final customer journey map, which will be a representation of all customer journeys combined.
2. Pull out the tasks/pain points/etc. users went through to accomplish their goal . As you read through interview transcripts or research notes, identify commonalities in the journeys. What were the common tasks, pain points, thoughts, and feelings users experienced? Then, determine in chronological order all of the tasks and activities that your final journey will include IN DETAIL.
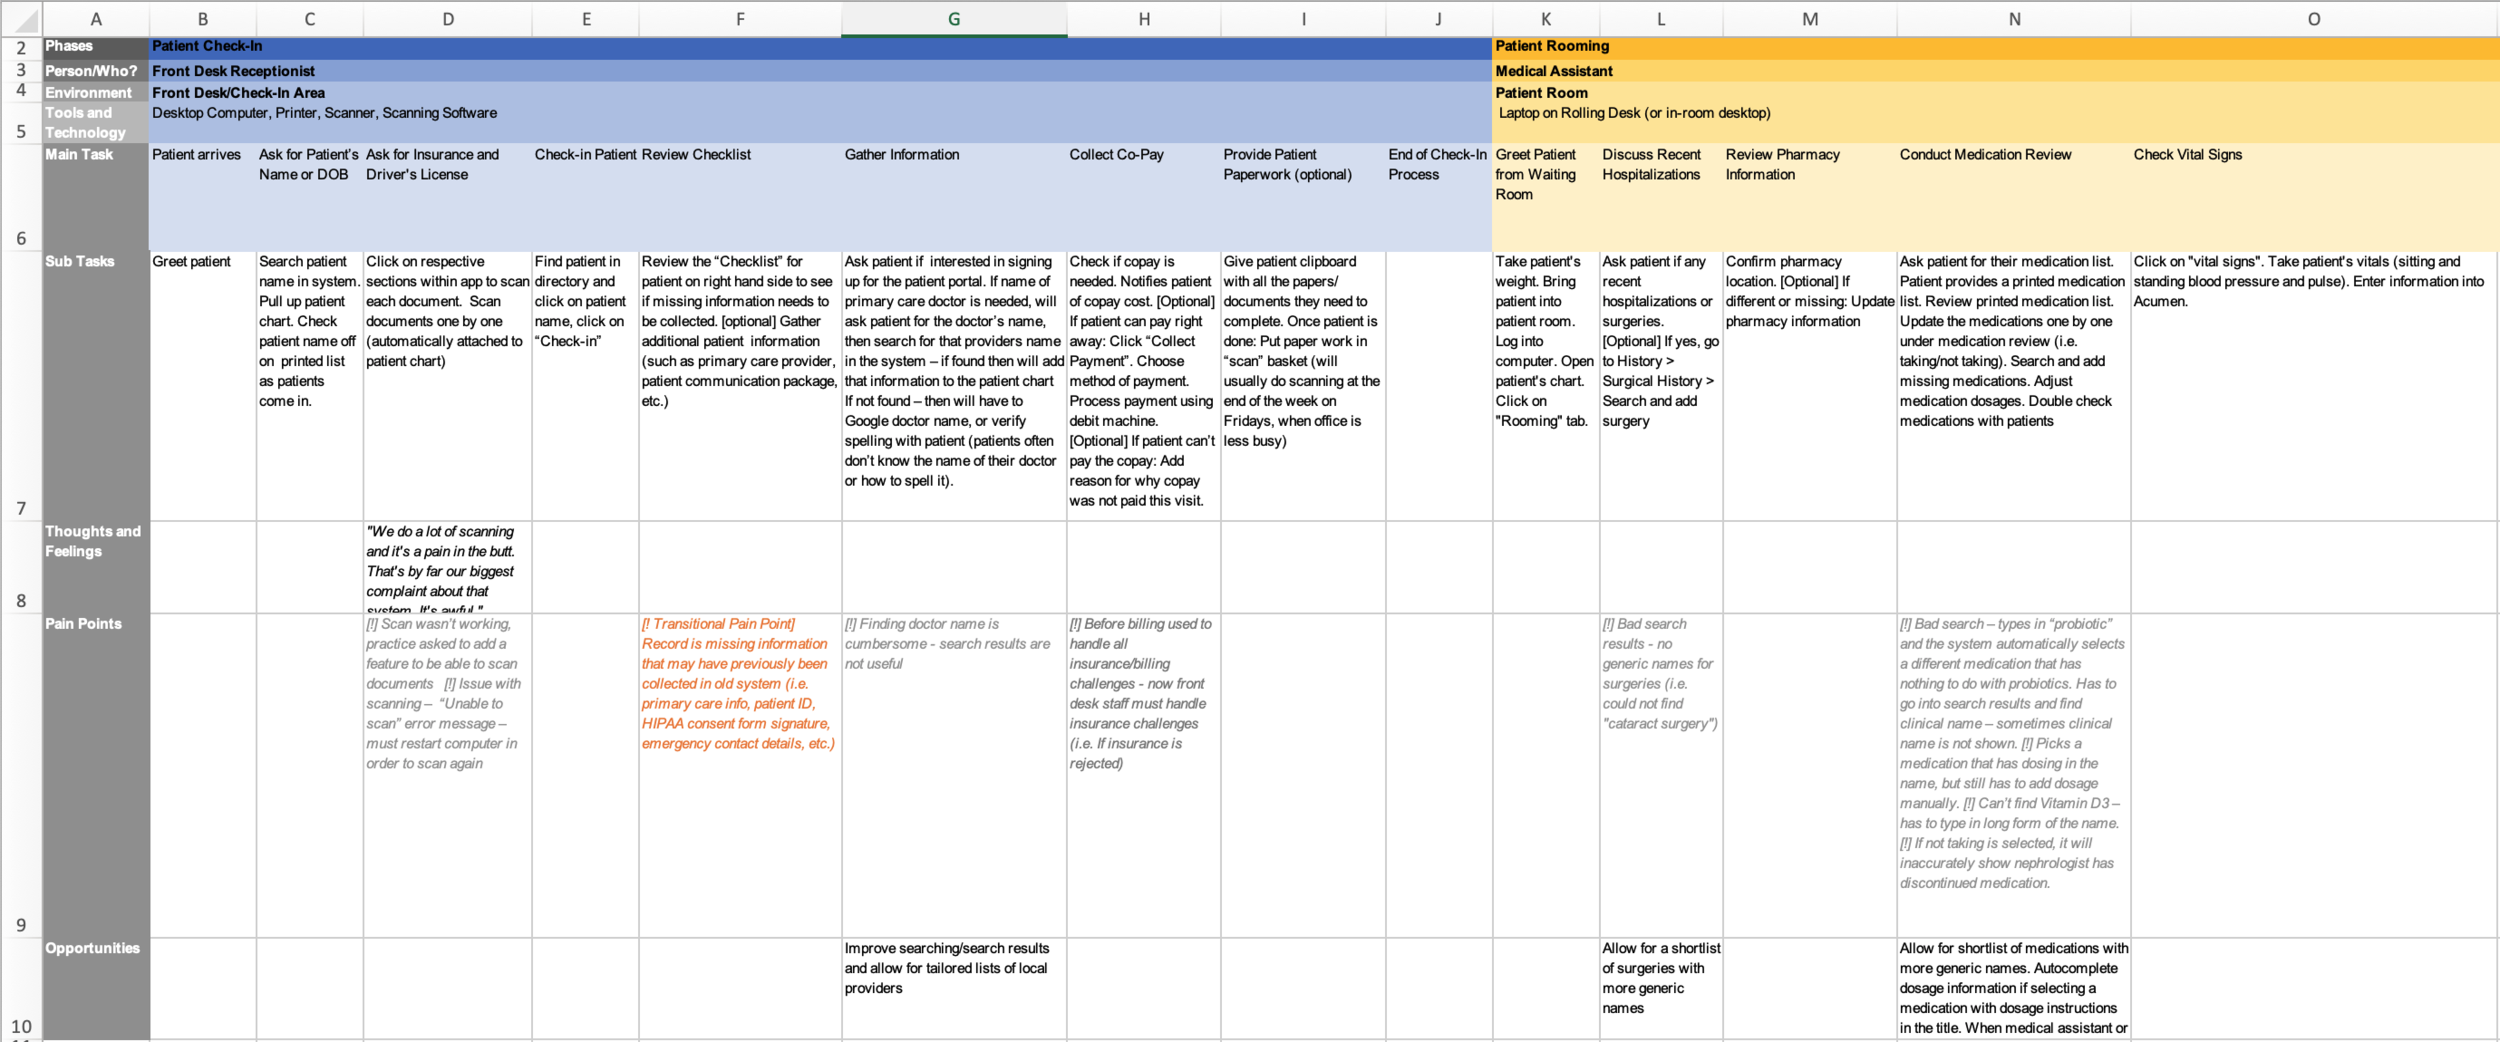
3. Start building your journey map! We recommend using a spreadsheet for this step in the process. In your spreadsheet:
-
The first column should include the following headers: Phases, Motivations, Main Tasks, Sub-Tasks, Touchpoints, Tools & Tech, Pain Points, and Opportunities (plus any other pieces of information you want to include).
-
Start filling out the “Main Tasks” row in chronological order for the entire journey. Each task should take up one cell (you can place Sub-Tasks in the row below a main task).
-
Once your tasks are filled in, go back to the beginning and add in other details, like which pain points users experienced for a particular task, which touchpoints they interacted with for that task, and so on.
-
Determine your high-level phases and list them out across the top of your spreadsheet (each phase will include multiple tasks).
-
Complete your spreadsheet by filling out as much detail as you can in each of the rows.
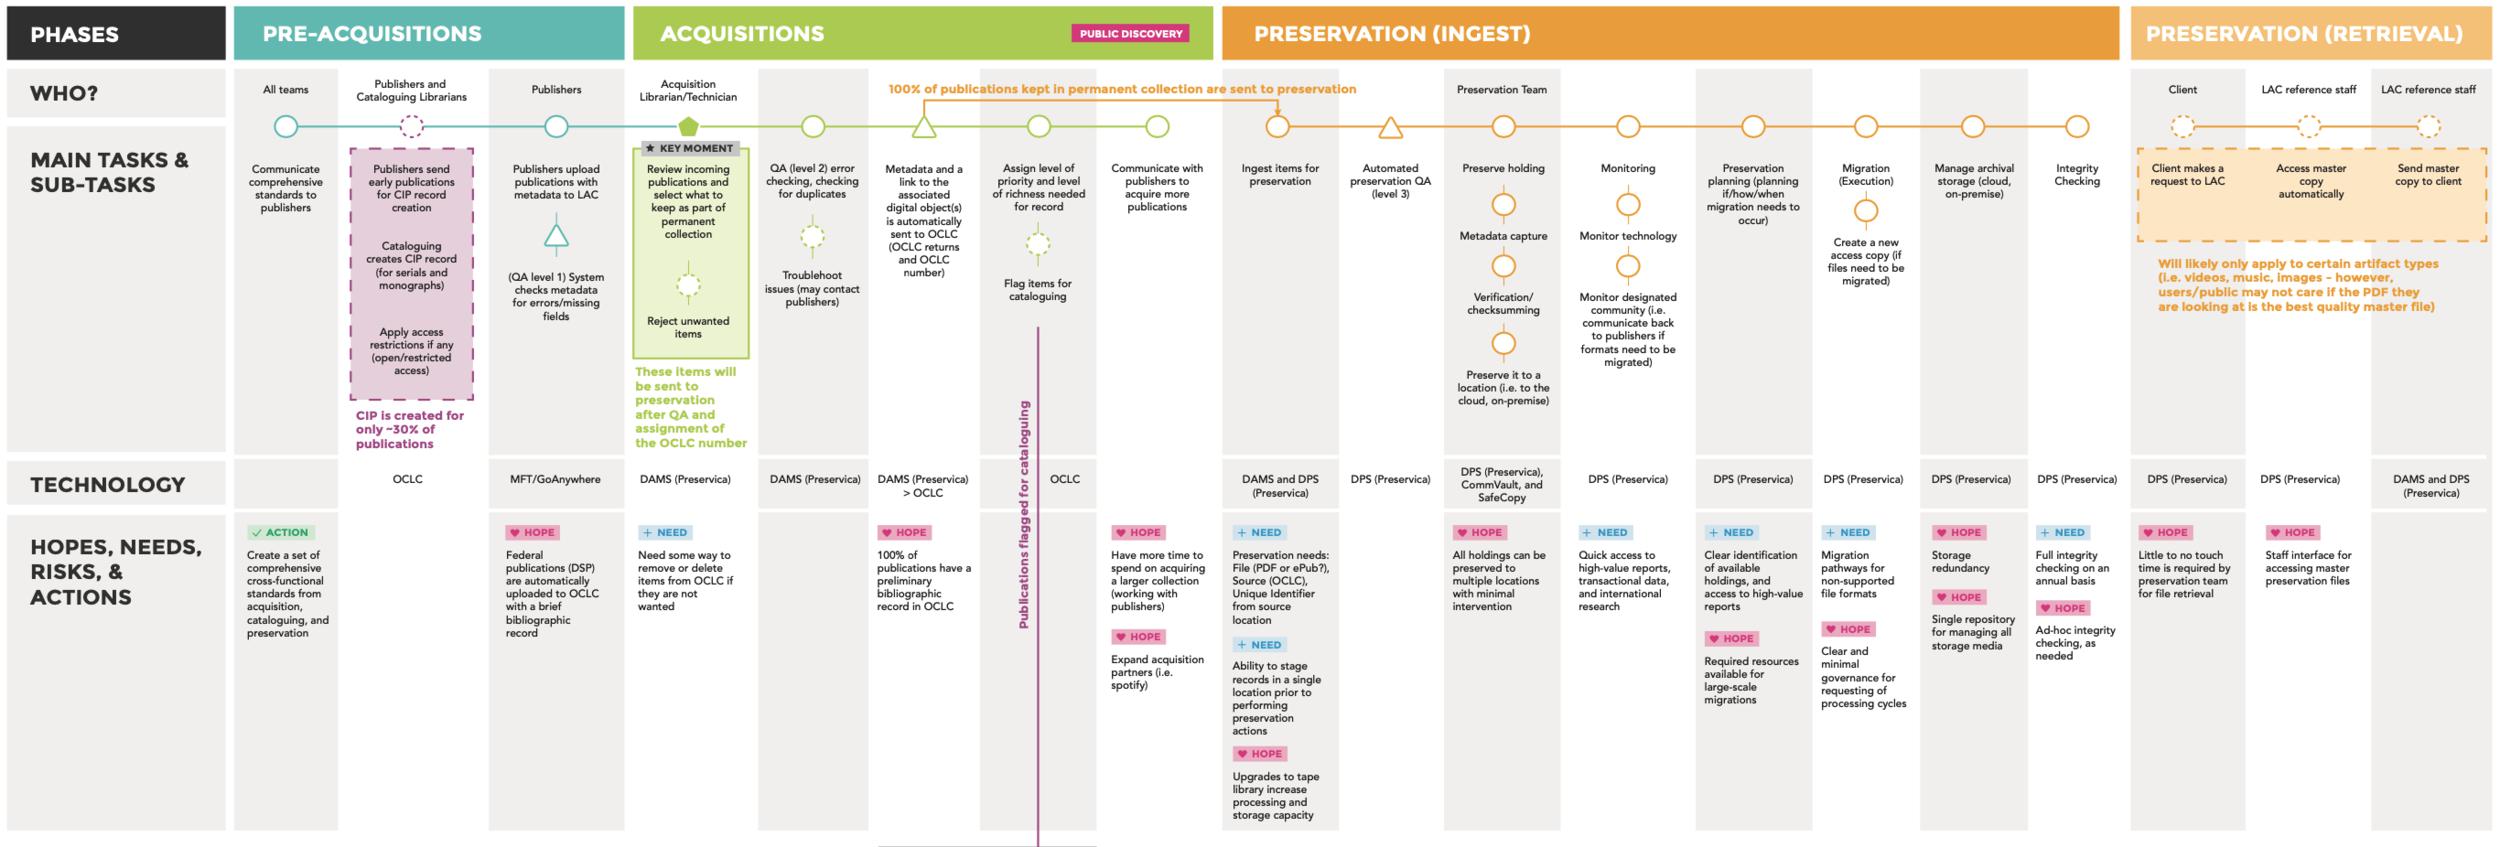
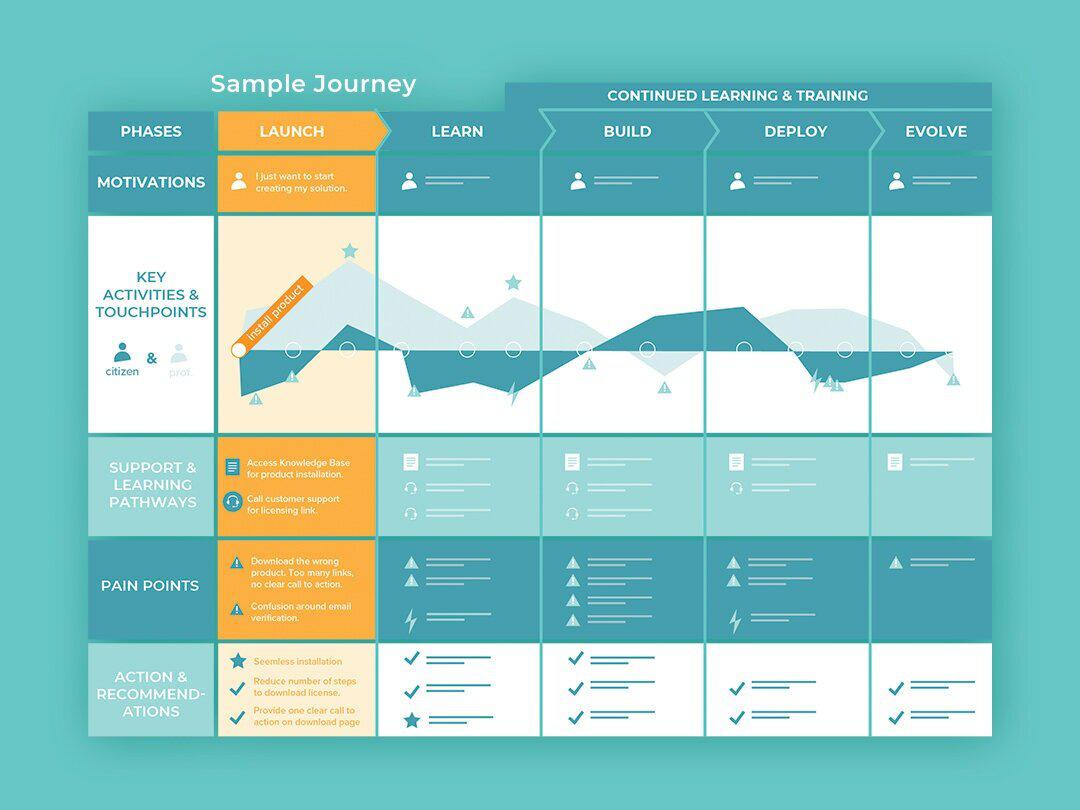
4. Visualize the journey map and bring it to life. Now that you have a skeleton of your journey map (in the form of a spreadsheet), you’re ready to visualize it. Use a program like Adobe Illustrator, or have a graphic designer help. To ensure your journey map is not overly text heavy, make sure readers can look at the journey and understand its overall meaning “at-a-glance”, with added details for readers who look more closely.
-
Use icons where possible to represent things like tools and technology, touchpoints, and pain points––or even smiley/sad faces next to the thoughts and feelings. This will make your map more readable at a glance. Ensure to include a legend that explains each icon.
-
Use colours for each phase or row/section. For large journey maps, you’ll want readers to be able to easily identify different sections: colour is a good way of segmenting the map.
-
Connect the dots. Use lines or arrows to indicate the order of steps, and to tie tasks together so that it is clear which tasks are completed first, second, third, and so on.
-
Highlight key moments or critical pain points. Make pivotal moments in the journey, both good and bad, stand out from the rest of the map. When a reader is quickly scanning, they will immediately notice these key moments and stop to read more.

Tip: Print out a large version of your customer journey map. We can confirm that there are few documents more impressive and show-stopping in an office than a 10 ft. customer journey map banner. Everyone will stop as they walk by, and this will build interest. Printed journey maps can also serve as an “anchor” for teams when they need inspiration, or when they have trouble remembering the research insights.
In the third and final segment of our Customer Journey Mapping blog series, we explore how to make your journey map highly actionable and how to evolve your map as your organization or team moves forward.
Resources we like…
-
Typeform and SurveyMonkey are tools we like for digital surveys
-
Capital One Design’s Guide to Baseline Journeys
-
Mapping Experience: A Complete Guide to Creating Value through Journeys, Blueprints, and Diagrams by Jim Kalbach. Outwitly CEO/founder Sara Fortier’s work is featured on page 97!
-
Communicating Design: Developing Web Site Documentation for Design and Planning by Dan M. Brown